Best free angular chart library 2021
chartlibrary, angular, angularchartlibrary


To what extent does your app rely on data? It probably does in some way. Even if the app is not exactly business-oriented, you’d probably need data for the admin panel, the dashboard, performance tracking, and similar analytics features that users love so much.
Visualizing data inside those apps and presenting them to end-users is a great responsibility. A data analysis is a most important because, Companies build strategies around the charts, numbers, and tables they’re presented with, and often use them to choose whether to pursue business opportunities. Therefore, choosing the right tools can in some cases is the difference between making it and breaking it.
The chart is one of the best ways to represent data. That will help you to make important decisions. It is important to represent a large amount of data in easy to understand and interactive way. To visualize complex data on your web app, you need a powerful chart library.
In this article, we will discuss Free Angular chart libraries 2021 for interactive data representation.
ngx-charts
ngx-charts are a declarative charting framework for angular2+.
ngx-charts allow us to customize the styles using CSS. We can also create custom charts using ngx-charts components.
It is using Angular to render and animate the SVG elements with all of its binding and speed goodness and uses d3 for the excellent math functions, scales, axis and shape generators, etc.
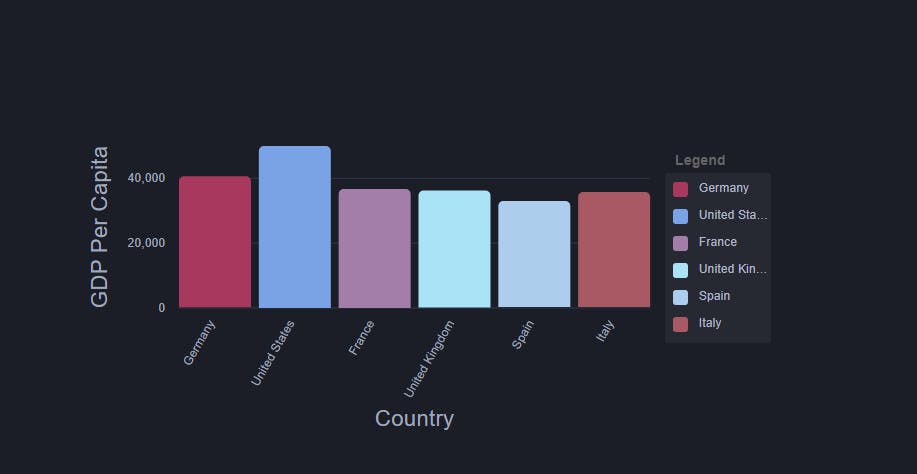
ngx-echarts
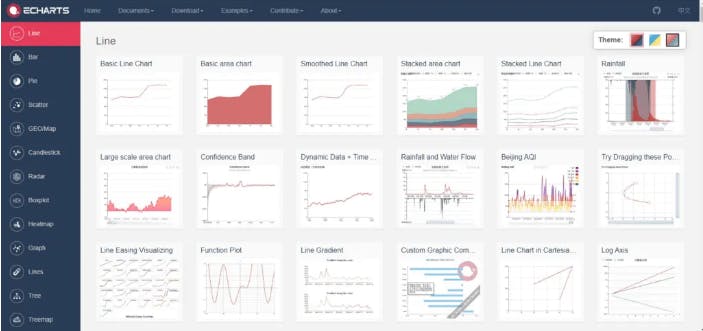
ngx-echarts is an Angular (ver >= 2.x) directive for ECharts (ver >= 3.x). ECharts is an open-sourced, web-based, cross-platform framework that supports the rapid construction of interactive visualization.
It can run fluently on PC and mobile devices. It is compatible with most modern Web Browsers, e.g., IE8/9/10/11, Chrome, Firefox, Safari and so on. ECharts depends on ZRender, a graphic rendering engine, to create intuitive, interactive, and highly-customizable charts.
ng2-charts
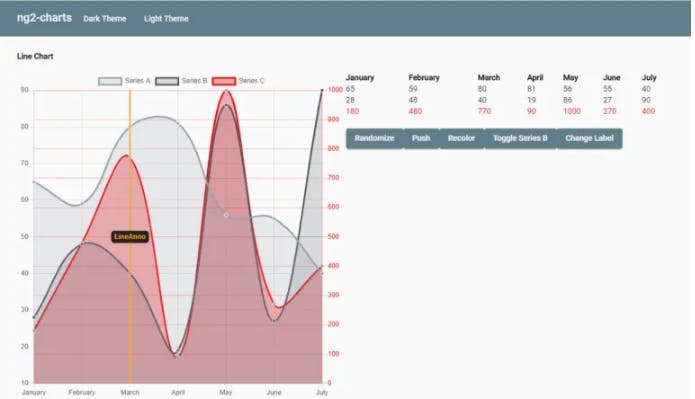
ng2-charts is an Angular2 directive for Chart.js.
Chart.js uses HTML5 canvas which provides great rendering performance across all modern browsers (IE11+). It provides schematics for easy integration in angular applications.
ng2-charts supports 8 chart types: line chart, bar chart, radar chart, pie chart, polar-area chart, doughnut chart, bubble chart, and scatter chart.
Angular-plotly.js
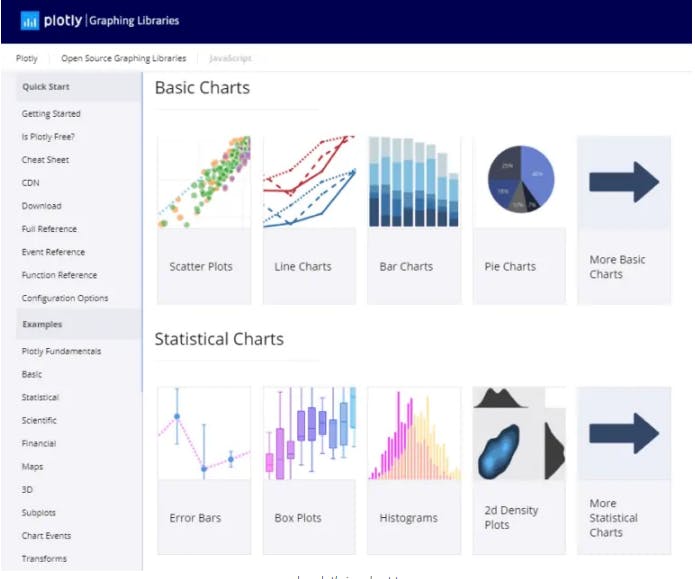
Angular-plotly.js is a plotly.js angular component from plotly.
It supports Angular 9.x, If you want to use with Angular 8.x, please use version angular-plotly.js@1.x
Built on top of d3.js and stack.gl, plotly.js is a high-level, declarative charting library. plotly.js ships with over 40 chart types, including scientific charts, 3D graphs, statistical charts, SVG maps, financial charts, and more.
PrimeNg chart
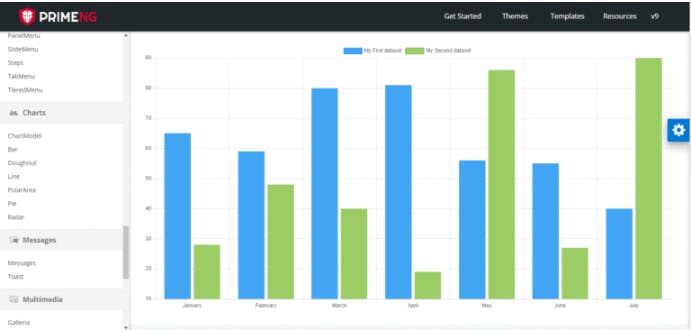
PrimeNg chart components are based on Charts.js 2.7.x, an open-source HTML5 based charting library.
PrimeNG is a collection of rich UI components for Angular. All widgets are open source and free to use under MIT License.
There are 6 options available; pie chart, doughnut chart, line (line or horizontal bar) chart, bar chart, radar chart, and polar area chart.
Angular Google chart
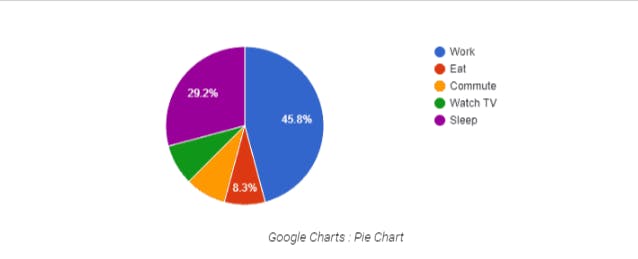
Angular Google chart is a wrapper of the Google chart library written for Angular 6 & 7. It is powerful simple and easy to use.
Google Charts is free, but not open-source. Google’s licensing does not allow you to host their JS files on your server.
Highcharts Angular
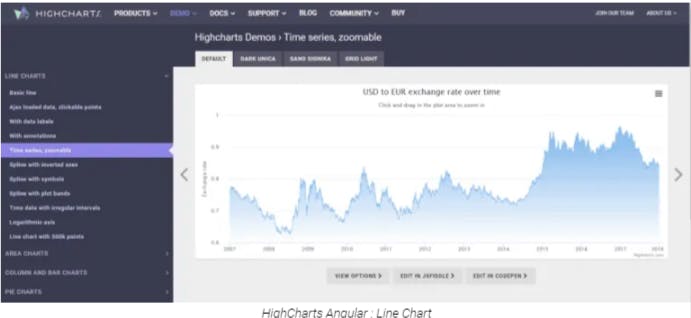
Highcharts is free for non-commercial use and paid for commercial use.
It is a modern SVG-based, multi-platform charting library. It has a rich set of chart collections.
Angular-fusioncharts
angular-fusioncharts is a simple and lightweight official Angular component for FusionCharts JavaScript charting library. angular-fusioncharts enables you to add JavaScript charts in your Angular application without any hassle.
FusionCharts is a JavaScript chart library and has charts like pie, column, area, line, radar, and over 150 other charts for web applications.
Conclusion
There are many chart libraries out there and the libraries listed here are just a few of those popular chart libraries.
Read more Article: Click here